The national GCSE data and individual secondary school outcomes, including the performance of EAL pupils, were released this month. These data give us lots of detailed information about the attainment and progress of EAL pupils at both national and school level. This brief analysis, however, comes with my usual health warning: data is much better at helping us ask thoughtful questions than it is at giving definitive answers.
The 2019 Attainment 8 figures show EAL pupils (47.6 in the downloadable national table and 48.3 when you add up all the local authorities)[1] outperforming English first language pupils (46.7) with the gap between the two groups rising slightly just as it did 2017 and 2018. Once again Pakistani pupils are the only large EAL group not outperforming English first language pupils, though the gap has closed from 1.3 in 2017 to 0.5 in 2019. Despite a small fall in performance the White Other group (which includes East European pupils) is now performing ahead of English first language pupils and Chinese and Indian pupils continue to be substantially ahead of all other groups.
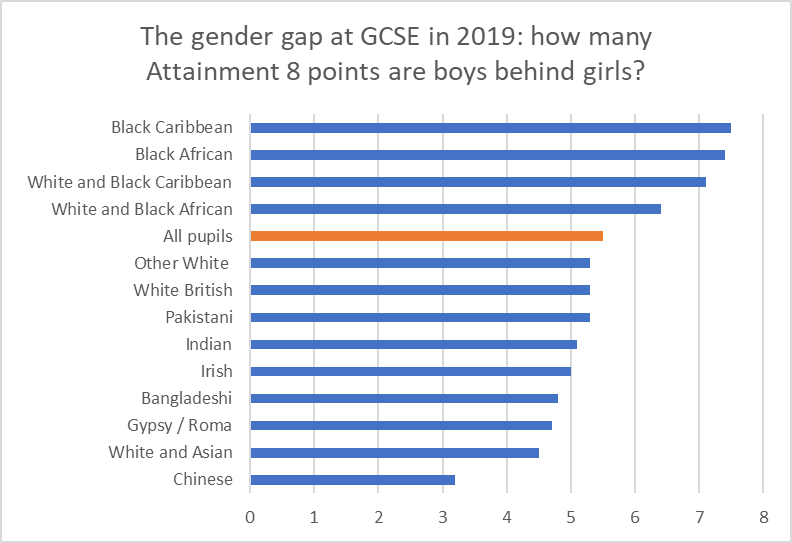
EAL pupils’ Progress 8 score, at 0.48, is a long way ahead of that of English first language pupils (-0.11), but fractionally down on 2018’s 0.49, a change accounted for by a small but continuing decline in EAL boys’ Progress 8 (it was 0.29 in 2017 and is now 0.22) This fall in Progress 8 is almost entirely among groups with the largest gender gaps: Pakistani and Black African. Encouragingly, Bangladeshi boys have now closed the gap on Bangladeshi girls to the national average gap. For Black boys this drop is not just an EAL issue. The only worse than average gender gaps in terms of both progress and attainment all involve different groups of Black boys.
There is variations by region in EAL performance. The South West and all of the regions in the North and the Midlands have Attainment 8 scores below the national average while London and the South East are above. With Progress 8 the pattern is a little different. The North East and the East Midlands have the highest Progress 8 scores, though Yorkshire and the Humber is lowest in terms of both progress and attainment.
Performance by local authority is also very varied, though differences in cohort size and the precise make up of EAL cohorts increases the level of caution we should exercise in drawing conclusions. If we only look at local authorities with more than 500 EAL pupils in the cohort, then Sutton tops the Attainment 8 table with a score of 65, while Bradford is last with just 40. Bradford does have over three times as many EAL pupils as Sutton, though its performance does not compare as well to the other five authorities with over 2000 EAL pupils in the GCSE cohort: Redbridge (54.4), Newham (50.1), Tower Hamlets (49.2), Manchester (46.9) and Birmingham (46.7). If we look at Progress 8 scores for authorities with more than 500 pupils, Merton is top with a score of 0.99, while Oldham at the bottom manages -0.07. Progress 8 scores comes with a 95% confidence interval which means they could, in statistical terms, be much higher or lower. In Merton’s’ case it could be as low as 0.87, but the high end of the confidence for interval for Oldham is just 0.10. So we can say that Merton’s Progress 8 score is definitely significantly better than Oldham’s.
The problem of finding statistical significance is even greater with individual schools. One school in Lambeth had no Progress 8 score at all last year because more than half of its pupils did not have a Key Stage 2 outcome- so its low Attainment 8 score of 36.5 does not tell us much that is worth knowing. Nonetheless, if we exclude selective schools, special schools and schools with a GCSE cohort containing 30 or fewer EAL learners, there are a total of 726 schools. It is not surprising that just over half of the schools are above the national score of 0.48 and just under half below. Nor is it surprising, given what we know about regional performance that just two of the top 20 are outside London and the South East and only one of the bottom 20 is in London or the South East. The Progress 8 scores range from 2.18 (Tauheedul Islam Girls’ High School in Blackburn) to -0.82 (Gloucester Academy) and have a more even regional distribution than the Attianment8 scores.
If you would like to know where your school and schools like yours sit in the EAL league table, but don’t want to wade through a very large DfE spreadsheet, then just get in touch through the form on the right.
Graham Smith
[1] The local authority figures aggregate school figures and so exclude EAL pupils whose UK education started after the beginning of Year 10.