The national Key Stage 2 data released in December have much to tell us about the performance of EAL pupils across England and the expectations we might have for our own EAL pupils. I will start, as always, with a data health warning. I have long taken the view that performance data rarely give you secure answers, but they often do help you to ask the right questions.
The overall gap between EAL pupils with English as first language and pupils with EAL on the key attainment measure of reading, writing and mathematics (RWM) at the expected level has reduced from a four percentage point gap in 2017 to just one percentage point in 2019. When you aggregate LA outcomes and exclude pupils who have been in English schools for fewer than two years, EAL pupils come out half a percentage point ahead at 65.8%. I think that means EAL pupils now officially outperform their English first language peers.
When we look at performance by subject, there has been one major change in the last two years: the eight percentage point advantage of English first language pupils in reading has been cut to just four percentage points. The differentials in writing and have barely changed.
Of course, not all EAL pupils are the same. Comparing your own school to the national benchmark can be misleading because there is significant variation in performance among the different groups where EAL is a major factor. The attainment of Pakistani and White Other (a proxy for East European in many places, but including a significant number Turkish pupils in some London local authorities and schools) pupils remains slightly below the national average. Chinese, Indian and Bangladeshi pupils are, as in 2017, largely above the national average in terms of expected performance. For Bangladeshi boys 2019 saw higher than expected performance go above the boys’ national average for the first time.
When we turn to progress measures we need to remember the blindingly obvious: the more English you have the better you do in tests in English. That is one reason (though far from the only one) why EAL pupils exceeded the national progress average in reading, writing and maths, regardless of ethnic background. In reading the best outcomes are for Chinese and White Other pupils, in writing Chinese and Bangladeshi pupils and in maths Chinese and Indian pupils. In 2019 Pakistani pupils exceeded for the first the national progress average on all measures.
When we look at EAL outcomes by region, local authority and school we see significant variation.
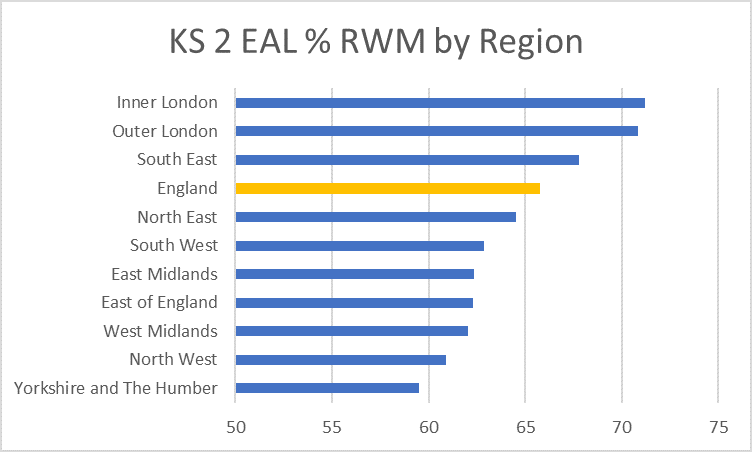
In London almost 71% of EAL pupils reached the expected standard in RWM, while in Yorkshire and the Humber barely 60% did so. The London result was in line with overall attainment in the region while EAL pupils in Yorkshire and the Humber were four percentage points behind the overall regional score.
In Trafford 80% of 631 EAL pupils reached the expected standard while in Bedford just 49% of 648 did. Twelve of the 20 highest performing authorities were in London. Four of Yorkshire and the Humber’s 15 authorities were in the bottom 20.
When we turn to performance at school level, overall numbers in particular schools are often too small to have much statistical significance. Nonetheless, the EAL data are publicly available. They are a little tricky to navigate, but definitely worth a look. For example, in both School A in Bermondsey and School B in Eastbourne 50% of the Year 6 cohort are recorded as having EAL. The free school meals figures are high, but a little different: 37% at School B and 50% at School A. In both schools the largest single minority ethnic group is White Other: 38% at School B and 21% at School A. The outcomes for EAL pupils, however, are very different: 91% of EAL pupils achieved the expected standard in RWM at School A and just 33% at School B. The reading progress scores are significantly different too: 8.5 at School A and -2.8 at School B. The data are insufficient to make a fulllly secure judgement, but they do help us to ask some good questions.[1]
[1] If you really want to, you can find out the name of these schools from the link above to the data. I haven’t named them because I don’t think we should name and shame schools when we don’t know all the facts. One important fact is that School B’s income is around £2500 less per pupil than School A’s.