The Department for Education has now published a useful analysis of its short lived English as an additional language proficiency scales. It tells us much of what we already knew: pupils do better in tests and exams in English when are they are more proficient in English: “EAL pupils are much less likely to be white than pupils with English as their first language” (well I never!) and “They are more likely to go to school in London and less likely to go to school in the South West.” However, the report is not simply a statement of the obvious. There is much helpful data and some useful analysis, but the data is most useful in the hands of EAL professionals because it helps us to think through what kind of assessment is happening in our schools and what kind of progress EAL pupils are making.
One of the big issues that arises is about the quality of data collection. It is interesting to learn that EAL pupils “are … more likely to be of primary school age – 64% of EAL pupils are in primary schools (compared to 57% of pupils with English first language).” We also learn that in Spring 2018 across English state schools there were 113,729 EAL pupils in Year 6, but only 69,946 EAL pupils in Year 7. The number of pupils in each year group was not very different so how can roughly 23% of Year 6 have EAL when only around 14% of Year 7 do. The 2018 Schools Census Guidance definition of a first language other than English tells us that “the pupil has been exposed to a language other than English during early development and continues to be exposed to this language in the home or in the community.”[1] But is this the definition applied in all schools?
This drop in numbers is inexplicable unless secondary schools are ignoring or nor receiving) the primary records and then some reclassifying EAL pupils as having English as their home language. Some secondary schools will probably say that they ask parents what the pupil’s first language is and the parents say English so they have to record English. You could ask the question (some secondary schools and many primary schools do) in a different way that reflects the census definition: what languages are used in your household? Gathering this information and asking further questions about what languages you have books in, what languages you watch television in and who speaks which languages in the home can help build a useful picture of the pupil’s language exposure and competencies. Which surely helps teachers to understand their pupils better. As the famous Tim Brighouse mantra goes, all good schools know their pupils and their families well.
The report also gives us some fascinating information about pupil progress through the proficiency scales. The 2017 judgements are compared to 2018.
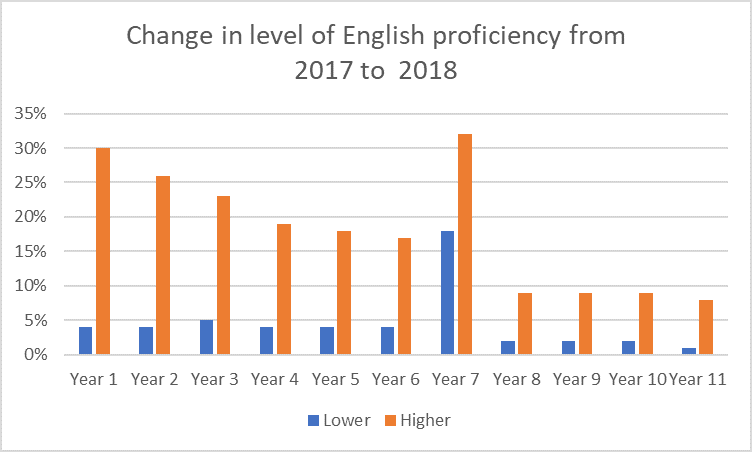
Years 1 to 6 make a lot of sense. An EAL learner starting in Reception is exposed all day to the English of their peers and teachers, possibly for the first time, so 30% of pupils progress up the five point proficiency scale is reasonable. The proportion progressing declines a little in each subsequent year, as you might expect. The bar is a bit higher each time. It also seems reasonable that the proportion of pupils with less fluency a year on is consistently low. I am not sure pupils do unlearn their English. Nonetheless, all kinds of disruption to young lives can get in the way of developing reading and writing in English. But what happens when EAL pupils they go to secondary school? According to the data one in five find their English proficiency level falling, a figure completely out of line with other years. You could argue that the language demands of the secondary curriculum are greater and this affects the assessments, but that would not account for the largest increase in proficiency also happening when pupils go to secondary school. Perhaps there is an explanation in the table that tell us about proficiency levels by year.
| Proficiency Scale/Code | |||||
| A (New to English) | B (Early acquisition) | C (Developing Competence) | D (Competent) | E (Fluent) | |
| Reception | 23% | 28% | 23% | 14% | 12% |
| Year 1 | 14% | 26% | 27% | 18% | 16% |
| Year 2 | 7% | 18% | 29% | 24% | 22% |
| Year 3 | 5% | 12% | 27% | 28% | 27% |
| Year 4 | 4% | 10% | 25% | 30% | 31% |
| Year 5 | 3% | 7% | 23% | 31% | 36% |
| Year 6 | 3% | 6% | 20% | 31% | 40% |
| Year 7 | 3% | 6% | 18% | 28% | 46% |
| Year 8 | 3% | 6% | 16% | 25% | 50% |
| Year 9 | 3% | 5% | 15% | 25% | 53% |
| Year 10 | 3% | 5% | 14% | 24% | 54% |
| Year 11 | 2% | 4% | 13% | 24% | 57% |
The proportion of pupils in each proficiency level across Years 6 and 7 is quite similar, even though there is dramatic drop in the overall number of EAL pupils. If we assume the pattern looked similar in the previous year, then could it be possible that fluent learners tended to be reclassified as native speakers of English in Year 7 and the competent as fluent? I know that is pure conjecture, but the drop in EAL numbers between Year 6 and Year 7 is such an odd phenomenon that we probably more than one explanation.
What does all this mean for schools? I think there are three key questions for schools to ask themselves:
- Can you ask parents about the languages used at home instead of asking what is the home language?
- How do you celebrate the multilingual nature of your school?
- How much better could your results be if you addressed the needs of the pupils classified as competent?
In part 2 of this blog I will look at the what the report tell us about proficiency levels in relation to ethnicity, languages and local authorities. I will also take another look at what the data tell us about progress rates for EAL pupils.