Following on from part 1 of my blog about The Department for Education’s useful analysis of its short lived English as an additional language proficiency scales, part 2 looks at what the report tells us about proficiency levels in relation to ethnicity, languages, regions and local authorities. I will also take another look at what the data tell us about progress rates for EAL pupils.
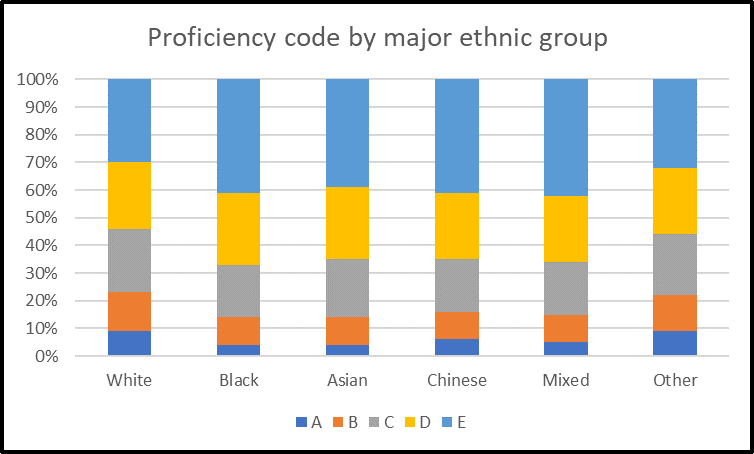
This graph is pretty much what experienced practitioners would expect with the highest fluency levels (code E) among Black, Asian and Chinese students. It is, however, worth noting the considerable variation in English proficiency levels within the white group.
EAL pupils whose ethnicity is recorded as White British or White Irish have the highest levels of English proficiency (72% and 77% are recorded as either competent or fluent), while those whose ethnicity is recorded as Gypsy/Roma or white other have the lowest levels (20% and 54%). While some people would say that it is not possible to be White British and have EAL, there are explanations for this phenomenon.
Firstly, it is parents who decide your ethnicity code and usually decide in the absence of clear guidance – having a British passport is evidence of your British citizenship, not your ethnicity. Nationality and ethnicity are not the same and the sociological concept of ethnicity is not one generally debated by the mass of residents in the UK. So it is no surprise that some EAL learners may be recorded as White British.
There are also children whom we would generally describe as White British because they have two White British parents. However, if the first part of schooling has been in Spanish (I know of a girl who started UK schooling at the age of 14 having previously been educated entirely in Spanish state schools), then despite the fact that your everyday English is fluent, you may have significant gaps in your in English scientific vocabulary, geographical vocabulary and so on.
More useful and making much more sense are the figures on first language[1], proficiency and whether they started in school in reception or joined the English system at a later date. The DfE publishes reasonably detailed ethnicity data every year[2], but language data is rare. What the report shows us is that there are almost as many Polish speakers as Urdu speakers in our schools and that Romanian speakers now outnumber the long-established Somali and Portuguese communities. The report confirms that Romanian speakers are much less likely to be fluent than Yoruba speakers and aligns with Steve Strand’s analysis of attainment by first language, which shows high levels of attainment among Yoruba speakers.[3]
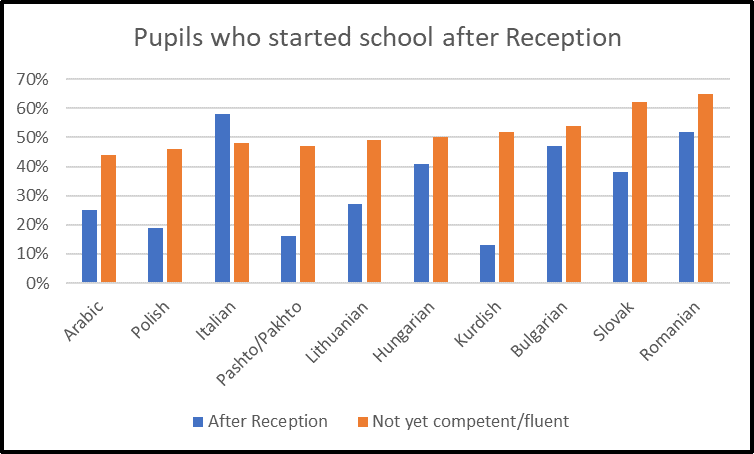
When we look at the languages with highest proportion of pupils who are not yet competent or fluent, we seem some correlation with late entry to the English school system. At the extreme ends of this phenomenon I am still puzzled by why Kurdish pupils (only 13% did not start in Reception) seem to make slow progress and why Italian speakers are the least likely of all to start in Reception (58%).[4]
Tracking pupils’ progress through proficiency scales confirms much of what we have learnt over many years within the EAL profession. The table below shows progress between Spring 2017 and 2018.
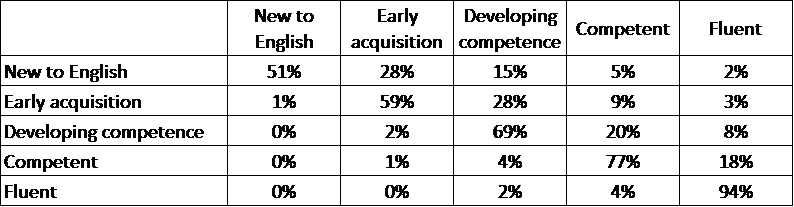
Put aside the absurdity of 2% moving from new to English to fluent in 12 months and it seems broadly right: the further you move up the proficiency scale the longer it takes to reach the next scale. That certainly fits with what most EAL teachers see most of the time. Supported immersion and scaffolding can take you a long way quite quickly, but teaching how academic English really works involves a lot more. Perhaps that is why the competent group seems to find it hardest to move on to the next level.
Finally, what does the report tell us about regional and local authority variation? At a regional level it seems to pose a question about the relationship between EAL density and fluency levels.
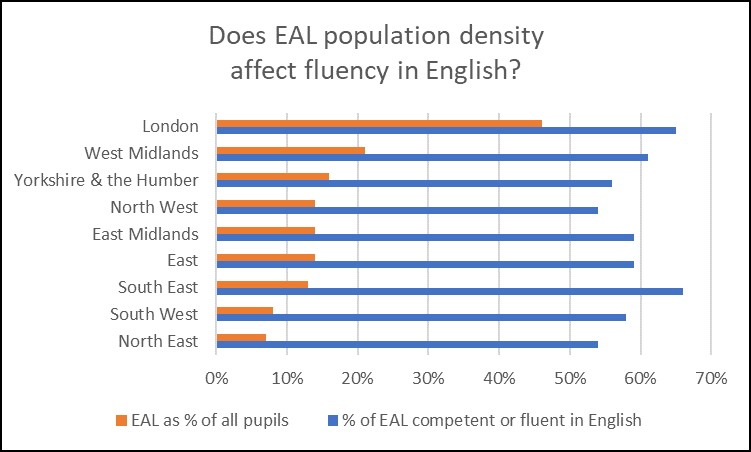
The North East with a significantly smaller proportion of EAL pupils than London has a markedly lower proportion od pupils who are competent or fluent. Could London’s higher density indicate great experience of EAL pupils and lead to more rapid progress? Does the North East’s lower density mean more isolated pupils make less progress. They are questions worth asking, but I think we need to know a lot more before we can produce competent answers.
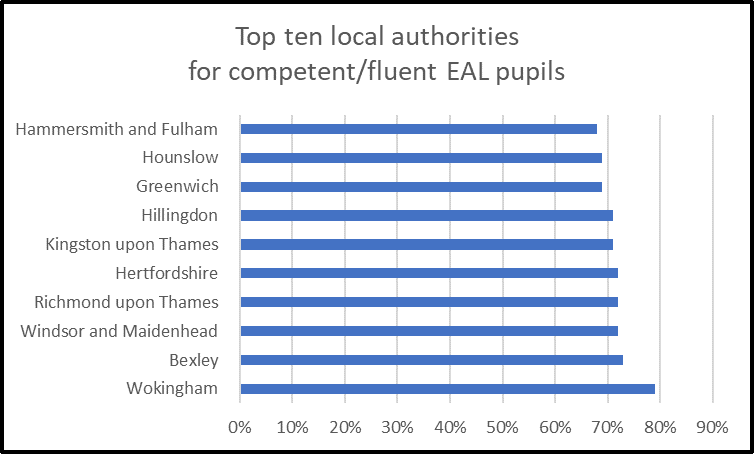
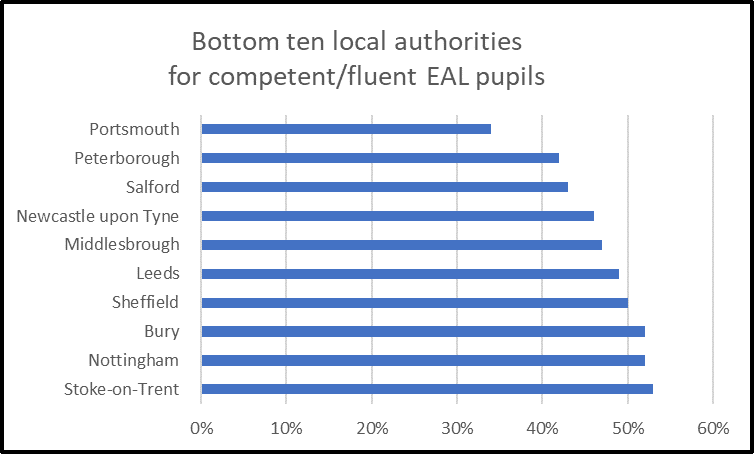
The proportion of pupils who are fluent or competent ranges in local authorities from 80% to 34%. Does that tell us anything worth knowing about individual local authorities?
It might tell us about the kind of EAL pupils they have[5]– the majority in schools or very isolated, rich or poor, new arrivals or UK born. It might tell us that some local authorities have worked with all the schools in the area on consistent, rigorous assessment procedures. From what I know of Portsmouth and Peterborough, that is the case. If we want see which local authorities have the lowest and highest fluency rates, it might be sensible to exclude those with very few EAL pupils (under 15% of the school population) and those with relatively few pupils joining school after Reception (again 15%). That leaves us with these graphs, which pose questions rather than providing answers.
[1] I am not sure that first language is a particularly helpful notion in an increasingly multilingual Britain, but it will have to do for our purposes here.
[2] Asian, for example, is broken down into Bangladeshi, Indian, Pakistani and Other.
[4] I did get some interesting explanations of the Italian phenomenon in response to a post I made on LinkedIn https://www.linkedin.com/posts/graham-smith-theealacademy_eal-schoolleadership-teachingandlearning-activity-6657983696051802112-tjCB.
[5] Even within local authorities there is variation. In the late 1990s I worked in Haringey. In the west of the borough EAL pupils often had European professional parents, who happened to be working in London. In the east there were a lot of Bangladeshi and Turkish pupils as well as recently arrived Somali and Kurdish refugees.